Global Crypto Market Cap in 2025: Past, Present, and Future Growth Predictions
The cryptocurrency industry has experienced extraordinary growth over the past decade, transforming from a niche community experiment into a multi-trillion-dollar global financial market. One of the key metrics used to measure this growth and overall industry health is the crypto market capitalization, commonly referred to as market cap. This figure reflects the total value of all cryptocurrencies combined, offering valuable insight into investor confidence, industry adoption, and future potential.
In this article, we’ll explore what market cap means, how it has evolved since the early days of Bitcoin, the current state of the market in 2025, and projections for where the total cryptocurrency market cap might be by the end of 2025, 2026, and 2027. We will also analyze the market drivers fueling its growth, compare it with traditional financial sectors, and examine the risks and opportunities ahead.
1. Understanding Crypto Market Capitalization
What is Market Cap?
Market capitalization, in the context of cryptocurrencies, is calculated by multiplying the current price of a cryptocurrency by its circulating supply. For example:
Market Cap = Current Price × Circulating Supply
If Bitcoin is priced at $100,000 and has 19.9 million coins in circulation, its market cap is:
$100,000 × 19,900,000 = $1.99 trillion
For the total crypto market cap, this calculation is performed for every cryptocurrency in existence, and the results are added together. The combined total represents the overall market size of the crypto industry.
Why Market Cap Matters
Market cap is a crucial indicator for several reasons:
- Investor Confidence – A rising market cap often indicates growing trust in cryptocurrencies as a legitimate asset class.
- Industry Health – Helps measure the strength and stability of the crypto market compared to traditional assets.
- Risk Assessment – A larger market cap generally implies more stability, while smaller caps can signal higher volatility.
- Adoption Trends – Reflects the level of institutional involvement and mainstream usage of cryptocurrencies.
2. The Early Days of Market Cap
Bitcoin’s Humble Beginnings
When Bitcoin launched in 2009, there was no concept of a “market cap” in the crypto world. Bitcoin traded for just a few cents, and its total value was negligible compared to global financial markets. The first known Bitcoin price was recorded in 2010 at around $0.003 per coin. With just a few thousand coins in circulation at that time, Bitcoin’s market cap was only a few dollars.
2013–2017: The First Boom
By 2013, Bitcoin crossed $1,000 for the first time, and the total crypto market cap surpassed $10 billion. This period saw the introduction of altcoins such as Litecoin, Ripple (XRP), and Ethereum, which diversified the crypto landscape.
From 2015 to 2017, the market cap exploded due to increased media coverage, growing adoption, and the ICO (Initial Coin Offering) boom. By December 2017, the total crypto market cap hit $830 billion during the first major bull run.
2018–2020: The Correction Phase
Following the 2017 boom, the market experienced a sharp correction. By early 2018, the total crypto market cap fell below $300 billion and continued fluctuating in the years that followed. This was a period of consolidation and building – while prices fell, blockchain technology matured, and institutional interest slowly began to grow.
3. The Current State of the Market in 2025
2021–2022: The New Highs and Setbacks
In early 2021, Bitcoin’s market cap alone crossed the $1 trillion mark for the first time, pushing the total crypto market cap to nearly $3 trillion. However, 2022 saw major setbacks, including the collapse of Terra Luna and FTX, which shook investor confidence and drove the total market cap down to under $900 billion.
2023–2024: The Recovery
By 2023, regulatory clarity in countries like the United States, UAE, and Singapore helped restore investor trust. The approval of spot Bitcoin ETFs attracted significant institutional inflows. Technological innovations, such as Bitcoin ordinals (NFTs) and layer-2 scaling solutions, brought fresh utility to blockchain networks.
By late 2024, the total crypto market cap had climbed back to $4 trillion, with Bitcoin holding around 58% dominance and Ethereum at 13–14%.
2025: The Market at Present
In August 2025:
- Total Crypto Market Cap: ~$4.1 trillion
- Bitcoin Market Cap: ~$2.37 trillion (58% market share)
- Ethereum Market Cap: ~$558 billion
- Other Altcoins Combined: ~$1.17 trillion
This resurgence reflects strong institutional adoption, retail investor interest, and growing use cases for blockchain technology.
4. Factors Driving the Market in 2025
Regulatory Clarity
Regulations now provide a clearer framework for institutional investors to participate in crypto markets without fear of legal uncertainty. This has attracted pension funds, asset managers, and large corporations into the space.
Institutional Adoption
- Spot Bitcoin ETFs have opened the door for retirement accounts (401(k)s) to include cryptocurrency investments.
- Major banks and financial firms now offer crypto custody and trading services.
Global Macroeconomic Trends
With persistent inflation concerns, cryptocurrencies like Bitcoin are increasingly seen as digital gold—a hedge against fiat currency devaluation.
Technological Advancements
The adoption of layer-2 networks, cross-chain interoperability, and AI-powered blockchain analytics has made the industry more efficient and appealing to both developers and users.
5. Projections for 2025, 2026, and 2027
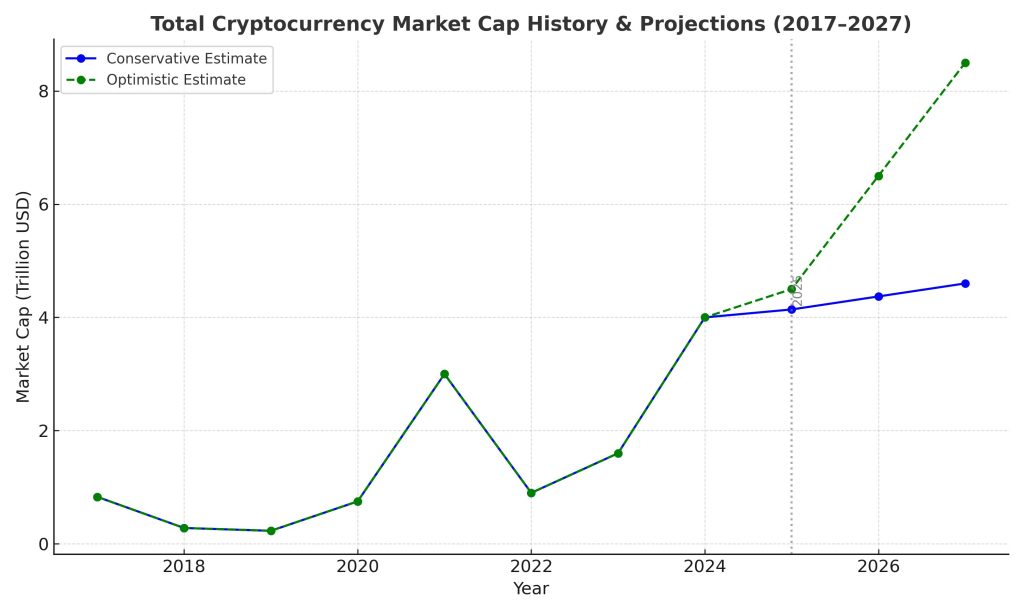
Conservative Estimates
Using current Bitcoin price projections and dominance rates, we can forecast:
| Year | BTC Price Est. | BTC Market Cap | Total Market Cap Est. |
|---|---|---|---|
| 2025 | ~$119k | ~$2.36T | ~$4.14T |
| 2026 | ~$125k | ~$2.49T | ~$4.37T |
| 2027 | ~$131.5k | ~$2.62T | ~$4.60T |
Optimistic Scenario
If Bitcoin reaches $5 trillion market cap by 2027 and maintains 60% market dominance, the total crypto market cap could soar to $8–9 trillion.
Bearish Scenario
If global regulations tighten significantly or major security incidents occur, the market could stagnate between $3–4 trillion over the next few years.
6. Comparing Crypto Market Cap to Traditional Assets
- Gold: ~$15 trillion
- Global Stock Market: ~$110 trillion
- Global Real Estate: ~$300 trillion
Even if the crypto market hits $10 trillion, it would still be a fraction of traditional financial sectors, suggesting massive growth potential ahead.
7. Opportunities and Risks Ahead
Opportunities
- Expansion of crypto into mainstream finance via ETFs and banking services.
- Increased adoption of stablecoins for cross-border payments.
- Growth in tokenized real-world assets (RWA) like bonds, real estate, and commodities.
Risks
- Regulatory crackdowns in major economies.
- Technological vulnerabilities like smart contract exploits.
- Market over-leverage leading to sudden crashes.
The total cryptocurrency market cap has grown from just a few dollars in 2009 to over $4 trillion today. While the road ahead will likely be volatile, the long-term trajectory remains bullish if adoption continues at its current pace. By 2027, the crypto industry could be worth anywhere between $4.6 trillion and $9 trillion, depending on economic conditions, investor sentiment, and regulatory decisions.
Crypto is no longer a fringe financial experiment – it’s a global asset class that is here to stay.