
The cryptocurrency market is currently witnessing a significant shift in sentiment as Bitcoin (BTC) displays early signs of stabilizing around the critical $70,000 threshold. This newfound resilience comes as a direct response to easing geopolitical concerns in the Middle East. Following a period of intense volatility where risk assets across the globe were hammered by fears of an escalating conflict involving Iran, a more optimistic tone has emerged. The initial market recovery appears tentative but promising, especially after a brutal multi-week selloff that saw Bitcoin’s price move in a strong negative correlation with spiking global oil prices. As macro sentiment begins to heal, the focus of the digital asset industry is shifting back toward internal fundamentals, specifically the return of institutional ETF momentum and shifting on-chain supply metrics.
The primary catalyst for this relief rally was recent rhetoric regarding de-escalation. Investors across both traditional and digital markets reacted with immediate buy pressure after political signals suggested that the risk of a broader war might be retreating. Just a fortnight ago, the climate was vastly different. Geopolitical panic had gripped the markets, driving Bitcoin down through the $66,000 support zone and eventually toward the $63,000 level. During that period, Brent crude oil briefly spiked to nearly $120 a barrel, creating a massive inflationary headwind that drained liquidity from risk-on assets. However, as oil prices retreated on Monday following suggestions that the conflict might be nearing a resolution, Bitcoin forcefully decoupled from struggling indices, climbing roughly 4% overnight.
De-Escalation Rhetoric and the Retreat of Macro Pressure
The direct impact of geopolitical stability on Bitcoin cannot be overstated. When the threat of supply disruptions through the Strait of Hormuz was at its peak, the market operated under a “flight to safety” manual, which paradoxically saw Bitcoin sold off alongside stocks in favor of the US Dollar and gold. With the softening of war rhetoric, that overarching macro pressure is rapidly vanishing. Risk assets reacted instantly to the news, with the S&P 500 closing higher, but Bitcoin’s 4% overnight jump indicated a much more aggressive return of buyer confidence. Investors are now moving away from crisis management and back into growth-oriented positioning as global stress metrics wind down.
This shift in policy momentum is crucial for the mid-term outlook. As the “war premium” is priced out of the oil market, the inflationary fears that previously threatened to delay interest rate cuts are also subsiding. For Bitcoin, which thrives in environments of high liquidity and low interest rates, the cooling of the energy market acts as a secondary bullish driver. Traders are now reassessing the forces driving crypto pricing, recognizing that while Bitcoin was temporarily dragged down by global events, its structural thesis remains intact. The current stabilization near $70,000 suggests that the market has absorbed the shock and is now looking for the next fundamental reason to push toward all-time highs.
Technical Analysis: Critical Bitcoin Price Levels to Watch
From a technical perspective, Bitcoin is currently navigating a complex recovery path. While the price is trading near $68,800, it is still battling lingering bearish dominance across short-term structures. It is important to note that the asset remains approximately 42% below its October all-time high of $126,080. This makes the current local consolidation highly critical; if Bitcoin can successfully turn the $70,000 level into a solid support floor, it would signal the end of the post-geopolitical correction. The next major upside target for the bulls sits around $75,000. Reaching this threshold, however, will require a sustained increase in trading volume and a significant shift in the Crypto Fear and Greed Index.
The sentiment data currently reflects a market in recovery but still scarred by recent events. The Fear and Greed Index recently hit an Extreme Fear reading of 13, a level rarely seen during an overall bull cycle. This suggests that while the price is rising, many retail participants are still hesitant to enter the market. Technical analysts are eyeing the $65,000 mark as the primary line of defense. If this support level fails to hold during the next round of volatility, bears will likely re-target the February floor of $63,000. A deeper breakdown below the $60,000 psychological floor would be a catastrophic signal of an institutional wipeout, but as long as the price stays above this level, the tentative recovery thesis remains the dominant narrative.
Examining Spot Demand and Institutional ETF Inflows
On-chain metrics provided by firms like Glassnode suggest that the worst of the recent market stress may be in the rearview mirror. Condition signals are beginning to stabilize as momentum and profitability metrics for short-term holders improve. The analytics suggest that while price momentum has firmed modestly, it currently lacks the “raw strength” usually associated with a decisive bullish pivot. This means the market is currently in a transition phase. The sustainability of the current bounce relies heavily on continuous spot Bitcoin ETF inflows. These institutional products are the primary engine for absorbing “trapped sellers” who bought at higher levels and are looking to exit at break-even.
Macroeconomists like Henrik Zeberg remain notably optimistic about this dynamic. Zeberg has forecasted that the sheer scale of institutional demand through ETFs could fuel a massive risk-on rally, potentially pushing Bitcoin into the $110,000 to $120,000 range once geopolitical headwinds vanish completely. However, the derivatives market tells a slightly more cautious story. Some analysts warn that the violent surge to $73,247 on March 4 was driven more by a “short squeeze” and negative funding rates than by pure spot accumulation. This implies that the current market floor is built on futures positioning, which can be more fragile than a floor built on genuine retail and institutional spot buying pressure.
The Path Forward: Ceasefires and Economic Triggers
Ultimately, the path toward a new all-time high for Bitcoin is paved with both psychological and fundamental milestones. Holding the $70,000 level for a sustained period is the first major requirement for clearing the path toward upper breakout targets by mid-month. On the downside, the $65,000 support must be rigorously defended by spot buyers as the market moves into the high-volume US trading sessions. The true macro trigger that will alter this price action remains the crude oil futures market and any further updates regarding ceasefires or diplomatic resolutions in the Middle East.
If institutional momentum holds steady and the ETF sector continues to see net inflows despite the recent macro shocks, Bitcoin could finish the week by firmly rejecting the sub-$60,000 “bear trap” narrative altogether. As the market decouples from geopolitical fear, the underlying scarcity of Bitcoin and the approaching shifts in global monetary policy are likely to take center stage once again. For the disciplined investor, the current “signs of improvement” represent a market that has been tested by fire and is proving its resilience in the face of complex global challenges.
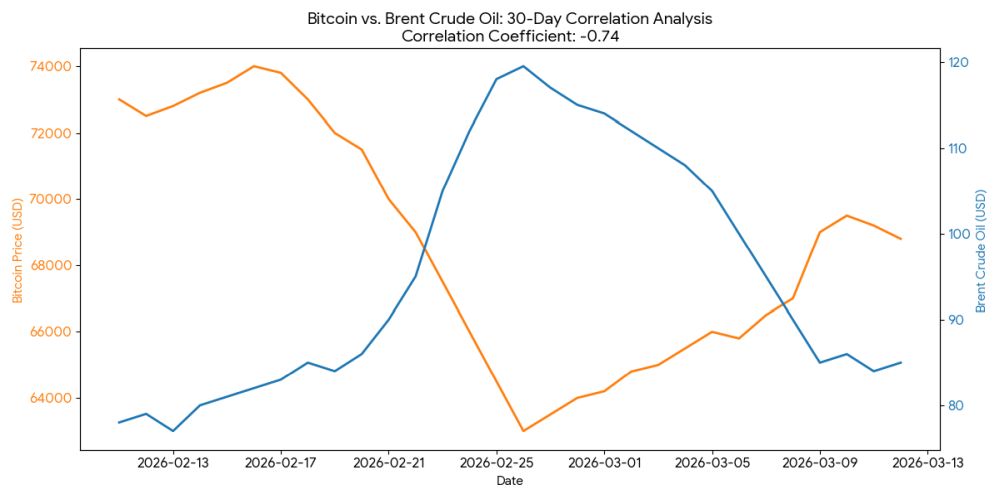
The correlation analysis between Bitcoin and Brent Crude oil over the last 30 days reveals a significant inverse relationship, with a correlation coefficient of approximately -0.74. This strong negative correlation confirms the narrative that as geopolitical tensions spiked—driving oil prices toward $120—Bitcoin was treated as a “risk-on” asset and sold off. Conversely, as de-escalation rhetoric cooled the energy market, Bitcoin began its recovery.
Understanding the BTC-Oil Inverse Correlation
This -0.74 correlation suggests that for much of the past month, Bitcoin and Oil have moved in opposite directions. In financial terms, this identifies oil as a “fear indicator” for the current macro environment. When oil prices surged due to the threat of supply disruptions in the Middle East, it signaled increased global inflation risk and potential economic instability.
Institutional and retail investors responded by de-risking their portfolios, which led to the temporary breakdown in Bitcoin’s price. However, the chart also shows the “decoupling” phase: as soon as the energy market stabilized, Bitcoin’s internal fundamentals (like ETF inflows) took back control, allowing it to climb even as oil remained relatively flat or declined.
Key Insights from the 30-Day Data:
- Tension Phase: During the peak of the conflict fears, Bitcoin reached a local bottom of $63,000 while Brent Crude hit its peak of $119.50.
- Recovery Phase: The pivot point occurred when de-escalation talk began; oil fell back toward $85, while Bitcoin surged back toward the $69,000-$70,000 range.
- Future Outlook: If this negative correlation continues to weaken, it will signal that Bitcoin is returning to its own independent market cycle, driven more by the Halving aftermath and ETF demand than by global energy shocks.