BNB Price Alert Why Technical Indicators Predict a Drop Toward 587 Dollars
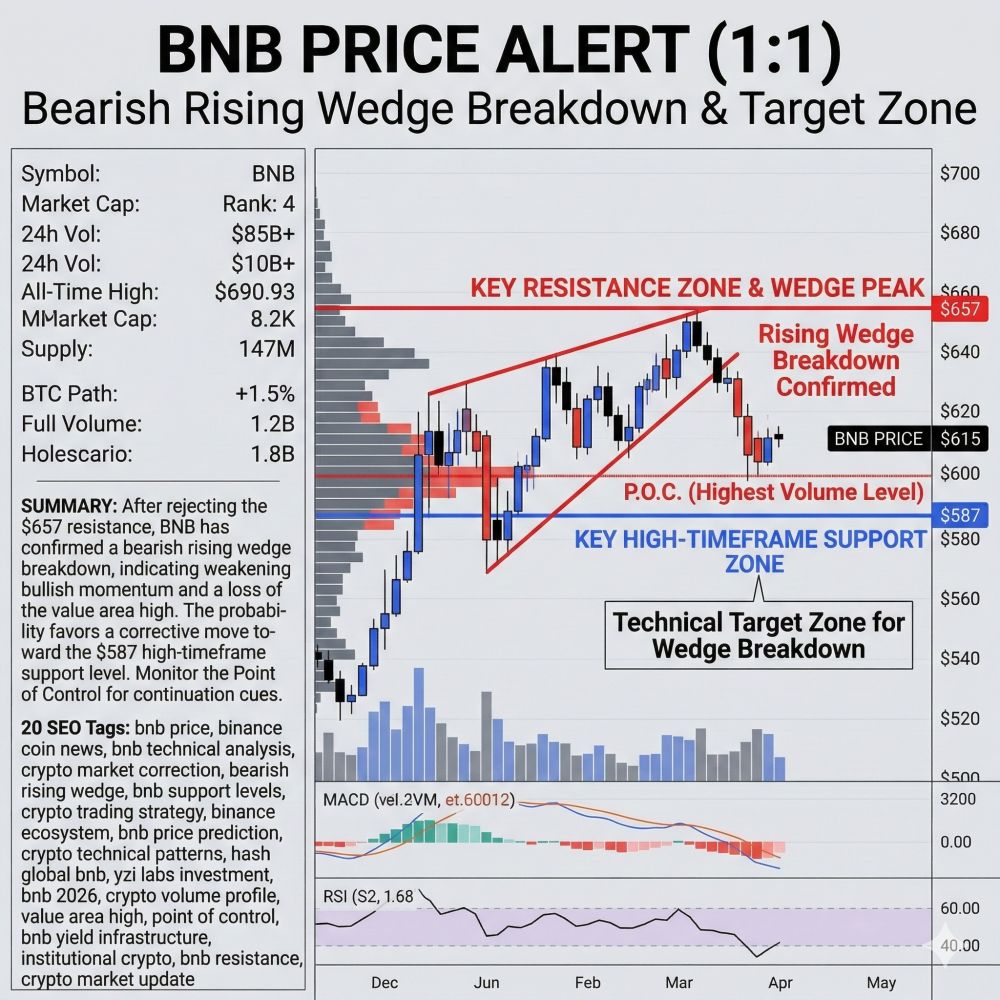
The Binance Coin ecosystem is currently navigating a period of significant technical turbulence as the price reflects a clear shift in market sentiment. After a sustained attempt to breach the 657 dollar resistance level, BNB has confirmed a bearish rising wedge breakdown. This specific chart pattern is widely regarded by technical analysts as a signal of bullish exhaustion. In a rising wedge, the price continues to make higher highs and higher lows, but the range narrows progressively, indicating that buyers are losing their conviction. The rejection at the 657 dollar mark served as the final catalyst for this breakdown, pushing the price through the lower support boundary of the wedge. With the Value Area High now lost, the technical structure suggests that the path of least resistance has shifted to the downside. Investors are now closely monitoring the 587 dollar support level as the most likely destination for this corrective phase.
This breakdown is particularly notable because it follows a period of tightening price action where every upward push was met with increased selling pressure. The 657 dollar level has historically acted as a major supply zone, where large holders often distribute their positions to newer market entrants. When the market failed to sustain itself above this pivot, it triggered a cascade of sell orders that forced the price out of its multi-week wedge structure. For traders, the activation of this bearish pattern often marks the beginning of a deleveraging event. As momentum traders exit their long positions, the lack of immediate buying support can lead to a rapid descent toward established high-timeframe support zones.
Analyzing the Impact of Losing the Value Area High on BNB Momentum
A critical development in the current BNB price action is the loss of the Value Area High. In volume profile analysis, the Value Area represents the price range where 70 percent of the trading volume took place over a specific period. The Value Area High acts as a psychological and technical ceiling; when price remains above it, the market is considered bullish. However, falling back below this level suggests that market participants no longer view the current prices as sustainable or attractive for accumulation. This loss of structural support reinforces the bearish wedge breakdown and signals that the market is entering a phase of redistribution.
Currently, BNB is hovering near its Point of Control, which is the specific price level with the highest traded volume within the range. This area typically serves as a temporary floor because it represents a zone of previous equilibrium between buyers and sellers. However, in the context of a rising wedge breakdown, the Point of Control often acts more like a speed bump than a permanent wall. If the selling pressure continues to mount and the price slips below this high-volume node, the lack of structural support between the Point of Control and the 587 dollar target could lead to an accelerated move lower. Traders often refer to these gaps in volume as “liquidity voids,” where price can move very quickly because there is little historical trading activity to slow it down.
Institutional Support vs Technical Weakness the Hash Global Influence
While the technical charts for BNB currently lean toward the bearish side, the fundamental landscape remains surprisingly robust. A major highlight for the ecosystem is the recent commitment by YZi Labs to invest 100 million dollars into Hash Global’s BNB Holdings Fund. This move is a clear signal that institutional players still view BNB as a critical piece of yield infrastructure within the digital asset economy. Such a large-scale investment helps solidify BNB’s status as an institutional-grade asset, providing a long-term bullish narrative that contrasts sharply with the short-term technical indicators. For long-term holders, these institutional inflows provide a degree of confidence that the underlying ecosystem is healthy, even if the price faces a temporary 10 to 15 percent correction.
The paradox of crypto markets often lies in this disconnect between fundamental value and technical price action. While a 100 million dollar investment is a massive vote of confidence, it does not necessarily prevent technical corrections caused by overleveraged retail traders. In many cases, institutional buyers prefer these technical flushes as they provide a better entry point for large-scale accumulation. If the price does reach the 587 dollar support zone, it is highly likely that we will see increased buying activity from these institutional funds, looking to capitalize on the lower prices. This interaction between the “smart money” accumulation and the “weak hand” liquidation is what ultimately defines the bottom of a corrective move.
Strategic Outlook and Key Levels for BNB Traders in 2026
As we move deeper into the trading sessions of 2026, the strategy for most market participants will revolve around risk management near the 587 dollar level. This target aligns with the technical objective of the rising wedge and sits on a major high-timeframe support zone. Historically, these zones act as significant areas of interest where the market searches for a new balance. A successful defense of 587 dollars would suggest that the correction was merely a healthy reset of the market’s leverage, potentially setting the stage for a new rally toward the 700 dollar range. On the other hand, a failure to hold this level could signal a more protracted bearish phase for the Binance ecosystem.
For the immediate future, the most important factor to watch is whether BNB can reclaim the Value Area High. Until that happens, the bears remain in control of the narrative. Market participants should also keep a close eye on the broader crypto market sentiment, as BNB rarely moves in total isolation. If major assets like Bitcoin face their own technical hurdles, it could amplify the downside pressure on BNB. Conversely, if the broader market stabilizes, BNB might find its footing sooner than expected. Regardless of the short-term volatility, the combination of institutional-grade yield infrastructure and a clearly defined technical roadmap provides traders with a transparent framework for navigating the coming weeks.